

CryptRowe Forecast #15
CryptRowe Forecast #15
Goblintown Part II: Livin' in a Goblin's Paradise

The CryptRowe Newsletter provides Math, Stats, and Data insight around the current state of Bitcoin and other Digital Assets. Whether you’re new to Crypto, have some experience, or are a seasoned investor or institutional fund manager, this newsletter is for you.
Dear Reader,
Hello and welcome to another edition of the bi-weekly CryptRowe newsletter! 🎉
The price action on Bitcoin and other Digital Assets hit around the range high again creeped up slowly over the last few weeks and has since dropped quite sharply down, teetering on the edge of a further drop. “Stairs up, ladder down” as they say.
Are we doomed for a further drop down? Or are we destined for moons above? Let’s tune in and keep reading to find out 🙃.
Sincerely,
Matt Rowe
Table of Contents
TLDR;
Macro Lens
Zooming Out
Zooming In
Price Levels
“So… should I buy now or no?”
Matt’s Portfolio
1: TLDR;
More and more bad news and Recession vibes continue to solidify and take shape. Things don’t look good on the Macro Economic level.
Long Term Buyers: are still in a great opportunity to have historically positive (outsized) returns in 6 mo. to 1 year.
Short Term Traders: I’m still expecting further downside (to start soon if it hasn’t already).
2: Macro Lens
Last Newsletter, we continued highlighting the two biggest Macro Economic headwinds against Digital Assets:
We are most likely in or heading into a Recession. And since Bitcoin is a Risk-On asset (currently), those don’t do well, usually, during a Recession.
Do I have good news to add to this glorious pile of bad news? No, no I do not. I do, however, have more bad news to share 🤦🏼♂️.
Consumer sentiment is pretty terrible right now.
Used Car indices that signal Recessions (canary in the coal-mine-esque) are flashing danger.
Real estate listings are being slashed around the country. Some data also suggests that it’s probably not a great time to buy a house or invest heavily in real estate.
Additionally, with all this uncertainty, no one is quite sure where oil or commodity prices are going to land. Could oil go down to $70 a barrel? Sure. Could it go to $300. Sure. That is what we call “unhelpful” analysis 😂. But I get it. What I read from that is that there are so many constraints and variables that no one is quite sure how supply chain + inflation + deflation (?) + global recession + war in Ukraine + European sanctions + etc are going to factor in and affect how much it costs to heat a home or drive a car. We have unprecedented (an overused word I hate using I know) supply constraints while also having unprecedented (there I go again) inflation numbers.
No bueno.
Though, regarding oil and commodities ~ Lyn Alden has a new article on this that argues for stable medium-high prices (longer term middle-tier pain for consumers). She uses integrals so, naturally, I am a fan 🙃.
Also, if you’re wondering “how bad can it get” for stocks take a look at this. More downside expected from many.
Ok so that’s a lot of confusion and bad news. But, I kind of lied. There is one glimmer of hope that I keep seeing around the interwebs of the FinTwitter and Macro-Econ world.
Basically, the premise of the “good news” is this: “Things will get so bad, that the Fed has to stop QT and start QE again.” In what ways and how bad does it need to get? Only time will tell. But “further pain” before “maybe some relief” isn’t exactly comforting. On this note, here’s a chart of the Fed’s historical “target QT” v. “when they start QE” again.
So… in summary. “Still bad. As time goes on more bad things become more clear. But it might become so bad that the Fed has to reverse course and provide relief (which most say will just push the pain / root problems down the road).” Eek.
Unrelated to the Recession (mostly) ~ a report came out recently evaluating the PPP. It wasn’t great. Basically showed that the PPP benefitted most those that were already wealthy / business owners / the top 20% and not to protect jobs as intended. 🤦🏼♂️
As a reminder, I am but a humble Mathematician and not a Macro Economist and most of what I learn about / signal comes from Lyn Alden, Ecoinometrics, and Mr. Alf. They are smarter than me about Macro things. Go to them for more 🙃.
Also if you’re wondering how I feel talking about Macro Economic things this is how I feel 😂.
3: Zooming Out
So, Macro Economics is not good. And this doesn’t bode well for Bitcoin. But what about High Time Frame (HTF, zoomed-out) On-Chain data?
My Aggregate Bitcoin On-Chain indicator (below) combines about 14 On-Chain and Technical Analysis indicators. (Apologies for the less-than-normal quality of images for my le charts, I am away from my trusty external monitor this week.)
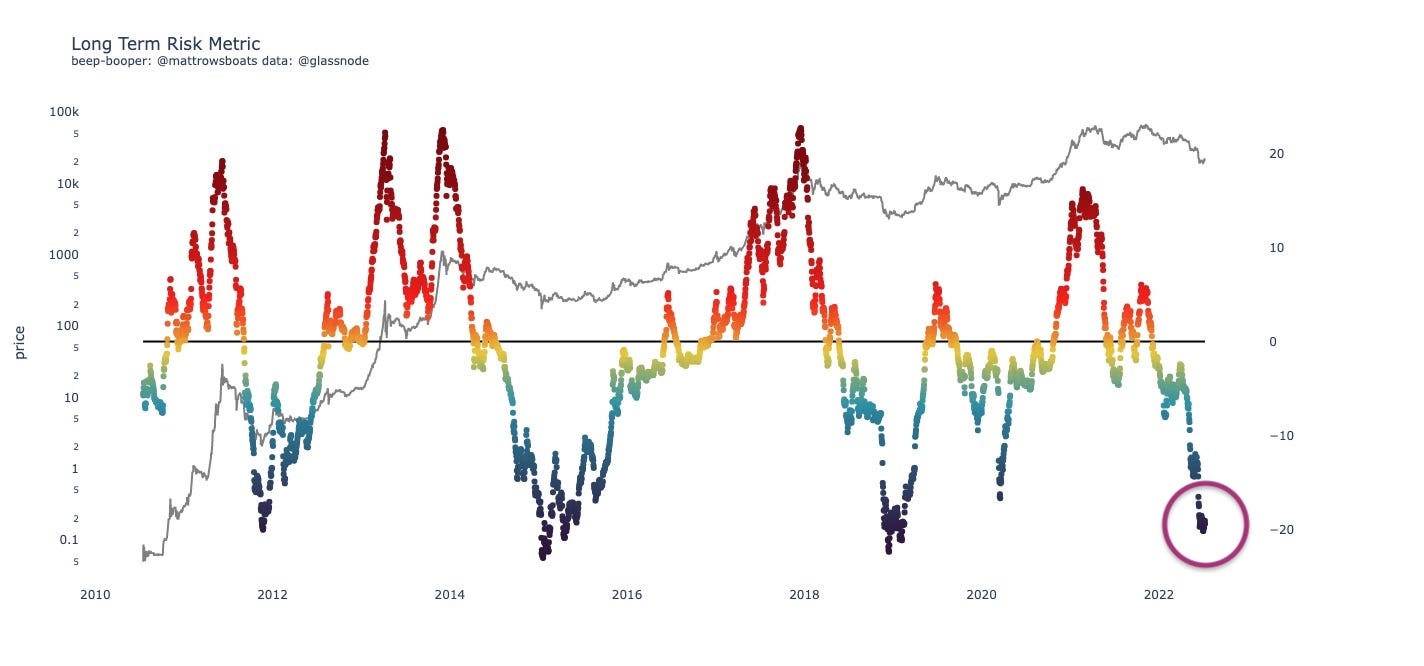
So we are still in a very great long-term buying opportunity. The outlook analysis we performed a few newsletters ago still holds. I re-ran it this morning to make sure and yes: if you hold for 6 months to 1 year from now, historically we’ve never had negative returns. And the min returns range from 37% to 800%.
Could this time be really different or even slightly different? Absolutely. We have a relatively small sample size (Bitcoin’s history of 12 years or so) and we are heading into an unprecedented Recession.
And.
It’s still great odds of outsized returns.
So, again, if you buy now or lower, and never look at the Bitcoin price again for 6 months to 1 year, the odds are really good you’ll be in profit.
One additional note to add here is: per last time as well, Long Term Holders are still sitting slightly in loss. Will they continue to hold in loss? Or capitulate?
My bet is on (further) capitulation. As you can see, given the macro environment we talked about above, and looking historically (the last two bear markets) we see longer drawdown phases than we see currently. I’m betting that trend continues and that we don’t get a v-shaped recovery like we did in Covid.
But, again, I could be wrong. Always ready to be invalidated and looking out for that.
4: Zooming In
On a shorter-term horizon, here’s the Binary Aggregate chart I built.
It combines some of the metrics I look at for confluence of momentum. Each of the metrics has a “above/below” signal that helps show whether it’s a good time to buy or not. I just put them all together.
It uses the:
Hodl Wave Crosses (24h-1m and 1m-3m)
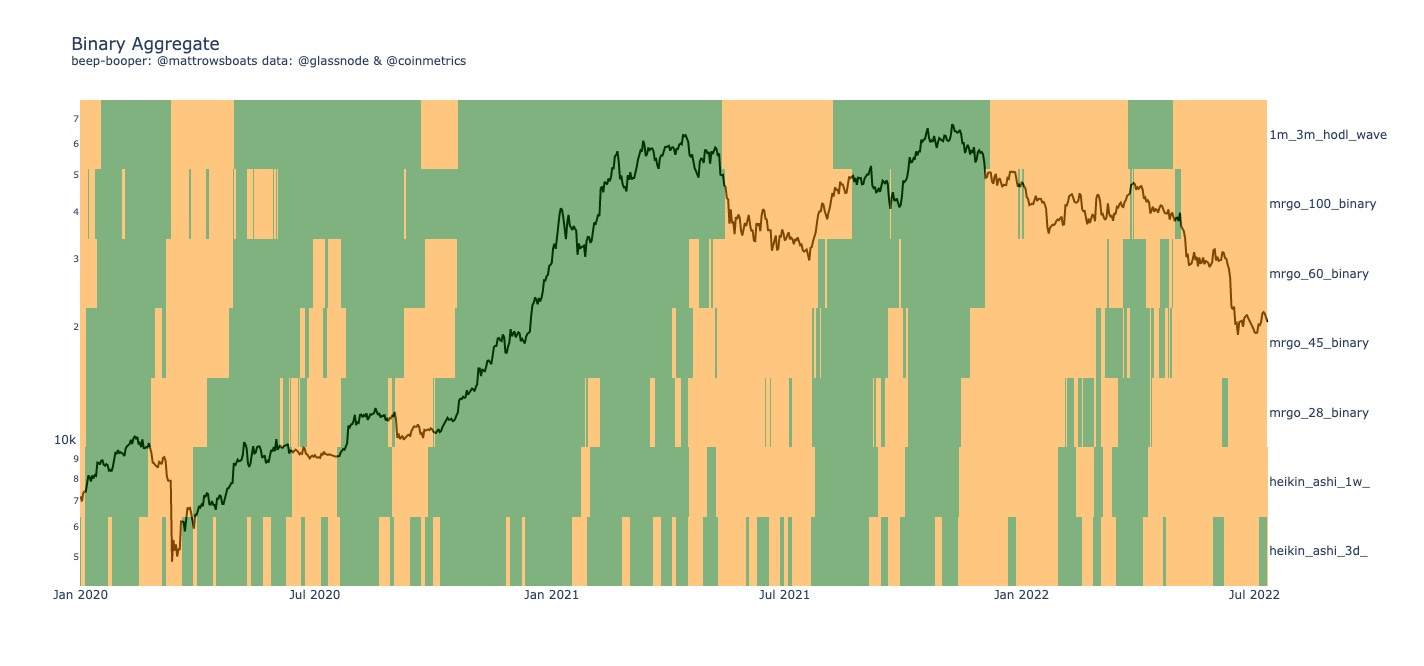
Some green fakeouts on the 3d Heikin Ashi but basically still in desert territory (no strong momentum upward).
Additionally, there is some positive confluence on the Entity Cohort stacking charts I’ve talked about previously, but the net change is less than 1% and I consider a false positive at this point. If that changes I’ll let you all know 🙃.
Still a time to be defensive and in cash from a short term perspective, imo.
5: Price Levels
So Macro is not great. But the long term buying opportunity is pretty amazing. But the short term is also not great.
What price levels should we be watching?
Nothing changed really from the TA (Technical Analysis) chart from last time. $14k-16k for a “soft-ish” landing. Around $10k for a hard landing. The previous ATH we are flirting around right now looks like quite weak support.
Here’s some updated (blockchain) On-Chain levels of note:
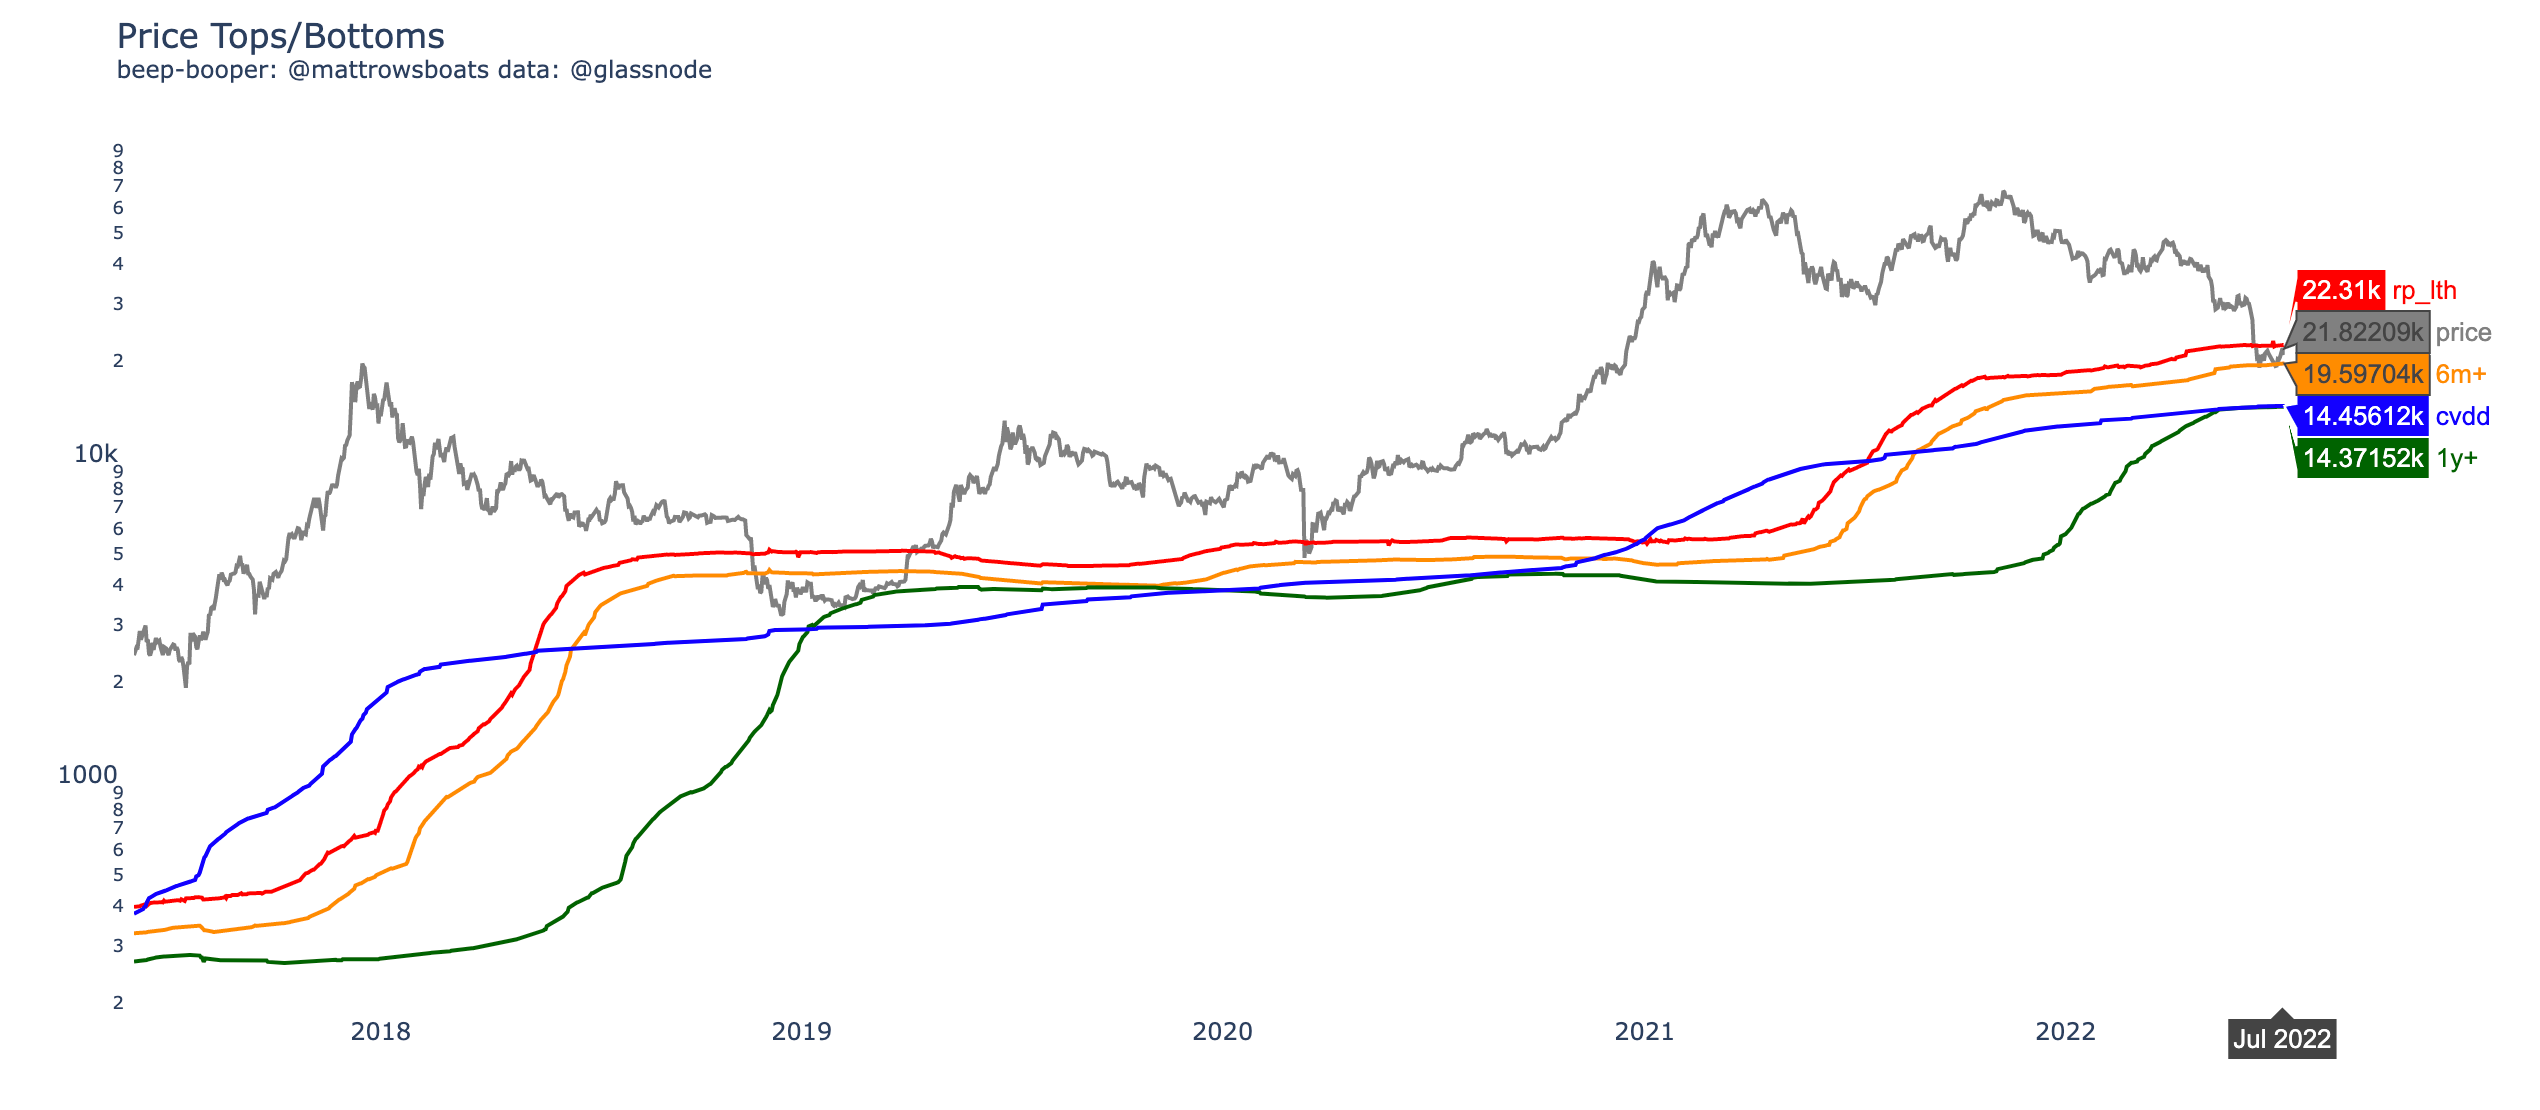
Given there’s some confluence for both TA + On-chain around $14k - $16k I would feel pretty good about targeting bids there. Breaks below that would feel like a temporary swan dive down to me.
6: “So… should I buy now or no?”
“I Dollar Cost Average (DCA)!”
Yes, I would be buying if I were you… one should always be buying on their DCA cadence 😏😊. As a reminder, DCA is great for folks who value an asset’s long-term potential but don’t have the time nor expertise to try and time tops/bottoms.
If you scale your DCA quantity by whether we are bearish or bullish, now is a great time to scale up the quantity (size or frequency) of your DCA since we are in such a bearish phase.
“I’m a long term 1-2 year investor.”
Yes, I would be and did buy some long-term holdings here. I will also buy more if it goes lower. My target is $14k - $16k for unloading a large portion of my cash bags. Remember, if you’re a 1-2 year investor, “exact timing” or “exact price levels” is a nonsense game to play. Patience is power for the long term investor.
“I’m a short term investor / trader.”
I still am not buying here. I don’t see any confluence on the desert (binary aggregate) chart above. The recessionary vibes are still looming and feeling like they’re growing. Alts are showing weakness like I mentioned last letter (my instinct for alts ripping up 30% - 80% during a Recession feeling off so far is proving to be right). In all things, remember: keeping capital safe and secure in a bear market is top priority.
7: Matt’s Portfolio
My Long Term Portfolio is still 80% in USD and 20% in BTC (put it in Cold Storage).
Trading, I’m still in USD and waiting for lower lows to come. In general, I’m still looking for and waiting for bullish convergence of data and indicators to jump back in. Invalidation to me would be a rip above $23k or more with strength (but even then I’d need to see a lot of consistent strength - without would be skeptical).
Still not there yet.
Stay safe folks 🤝.
Closing
And that’s it! As always, if you have questions, desires for clarification, or thoughts on how to improve this letter for yourself or others please reply and let me know or reach out on Twitter.
Also, if you are interested in any kinds of individual consulting services regarding your own Bitcoin or Crypto journey (getting started, trading, analytics, learning, advising, etc.), feel free to respond to this email or follow / reach out to me on Twitter, where I also post more nuanced / individual metric-specific charts there more often.
As always, this post is free and if you enjoyed it or learned something feel free to share it 😊 🎉.
Also… in case all of this Recession + Bearish news is getting you down here’s a picture of a dog that made me laugh.


Thank you for reading!
Sincerely,
Matt Rowe
Links and References
Data Provider: Glassnode (free on-chain charts, paid tiers available, I have T3).
My Twitter: @mattrowsboats (often provides on-chain analysis)
Crypto Learning Twitter Lists: On-Chain, Macro-Econ, and TA.
Disclaimer 1
Exercise caution, don’t lose it all. Please don’t trade on this newsletter assuming it is perfect information. Everything here is probabilistic and based off of past patterns, which may prove to be invalidated. Short time frames are subject to less accuracy as markets can change on a dime due to a variety of factors and events in the world. Use risk management as much as possible.
Disclaimer 2 (the all caps one)
THE CRYPTROWE NEWSLETTER DOES NOT MAKE ANY EXPRESS OR IMPLIED WARRANTIES, REPRESENTATIONS OR ENDORSEMENTS WHATSOEVER WITH REGARD TO THE REPORT/BLOG. IN PARTICULAR, YOU AGREE THAT THE CRYPTROWE NEWSLETTER ASSUMES NO WARRANTY FOR THE CORRECTNESS, ACCURACY AND COMPLETENESS OF THE REPORT/BLOG.
YOU ARE SOLELY RESPONSIBLE FOR YOUR OWN INVESTMENT DECISIONS. WE ARE NEITHER LIABLE NOR RESPONSIBLE FOR ANY INJURY, LOSSES OR DAMAGES ARISING IN CONNECTION WITH ANY INVESTMENT DECISION TAKEN OR MADE BY YOU BASED ON INFORMATION WE PROVIDE. NOTHING CONTAINED IN THE REPORT/BLOG SHALL CONSTITUTE ANY TYPE OF INVESTMENT ADVICE OR RECOMMENDATION (I.E., RECOMMENDATIONS AS TO WHETHER OR NOT TO “BUY”, “SELL”, “HOLD”, OR TO ENTER OR NOT TO ENTER INTO ANY OTHER TRANSACTION INVOLVING ANY CRYPTOCURRENCY). ALL INFORMATION PROVIDED BY THE CRYPTROWE NEWSLETTER IS IMPERSONAL AND NOT TAILORED TO YOUR NEEDS.
BY USING THIS REPORT/BLOG, YOU ACKNOWLEDGE THESE DISCLAIMERS.