

CryptRowe Forecast #16

The CryptRowe Newsletter provides Math, Stats, and Data insight around the current state of Bitcoin and other Digital Assets. Whether you’re new to Crypto, have some experience, or are a seasoned investor or institutional fund manager, this newsletter is for you.
Dear Reader,
Hello and welcome to another edition of the bi-weekly CryptRowe newsletter! 🎉
Since we last met, Bitcoin’s price action dipped to around $19k and then rallied to $24k, only to now be settling in to a range high around $21.9k.
Are we expecting a further bear market rally up? Or will the bears have another dance party? Let’s tune in and keep reading to find out 🙃.
Sincerely,
Matt Rowe
Table of Contents
TLDR;
Macro Lens
Zooming Out
Zooming In
Price Levels
“So… should I buy now or no?”
Matt’s Portfolio
Lol of the Day
1: TLDR;
More Recession news incoming / taking shape. S&P 500 Earnings week this week. Be on the lookout for high volatility potentially. Things don’t look good on the Macro Economic level.
Long Term Buyers: are still in a great opportunity to have historically positive (outsized) returns in 6 mo. to 1 year.
Short Term Traders: I’m still expecting further downside (to start soon if it hasn’t already).
2: Macro Lens
The two biggest Macro Economic headwinds against Digital Assets are still:
We are most likely in or heading into a Recession. And since Bitcoin is a Risk-On asset (currently), those don’t do well, usually, during a Recession.
QT has begun (and is still slowly ramping up), which adversely affects Risk-On assets (again, of which BTC is currently).
In general, still no “positive” Macro News.
This is a big week as Earnings for Big Tech are released. If you’re curious about what average returns are for the S&P 500 by Earnings Season Week here’s a delightful lookback analysis by Mr. Blonde.
One of my fave thinkers, Ecoinometrics, has a chart showing historical drawdowns and has them labeled which is delightful. He shows that regardless of how much further down we do or don’t go, the more unfortunate noticing is that we might be “here” for a while longer to recover (months to years).
Finally, there are still quite a few other “canary” indicators saying we are in a bad place and potentially will get worse.


As a reminder, I am but a humble Mathematician and not a Macro Economist and most of what I learn about / signal comes from Lyn Alden, Ecoinometrics, and Mr. Alf. They are smarter than me about Macro things. I am but Big Bird in a Macro Econ board meeting. Go to them for more 🙃.
3: Zooming Out
So, Macro Economics is still not good. And this doesn’t bode well for Bitcoin. But what about High Time Frame (HTF, zoomed-out) On-Chain data?
My Aggregate Bitcoin On-Chain indicator (below) combines about 14 On-Chain and Technical Analysis indicators.
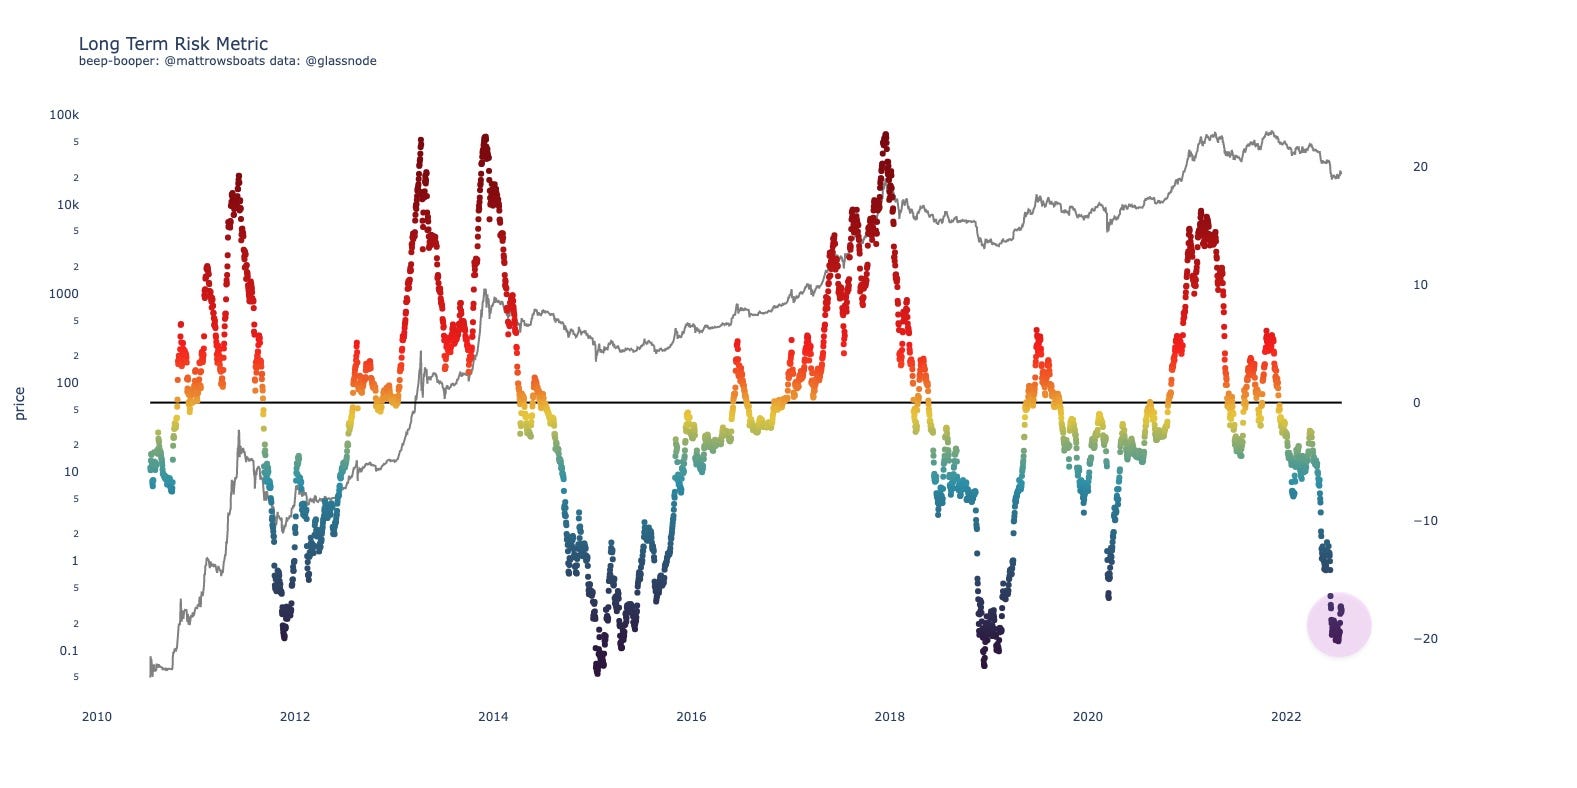
So we are still in a very great long-term buying opportunity. The outlook analysis we performed a few newsletters ago still holds. The uptick, of course, will skew towards “more risky” to buy now, but only every so slightly.
So long term, still great odds of outsized returns. If you buy now or lower, and never look at the Bitcoin price again for 6 months to 1 year, the odds are really good you’ll be in profit.
One reason I haven’t deployed all of my capital here though (and more on this below) is the Long Term Holder and Short Term Holder Cost Basis (Realized Price).
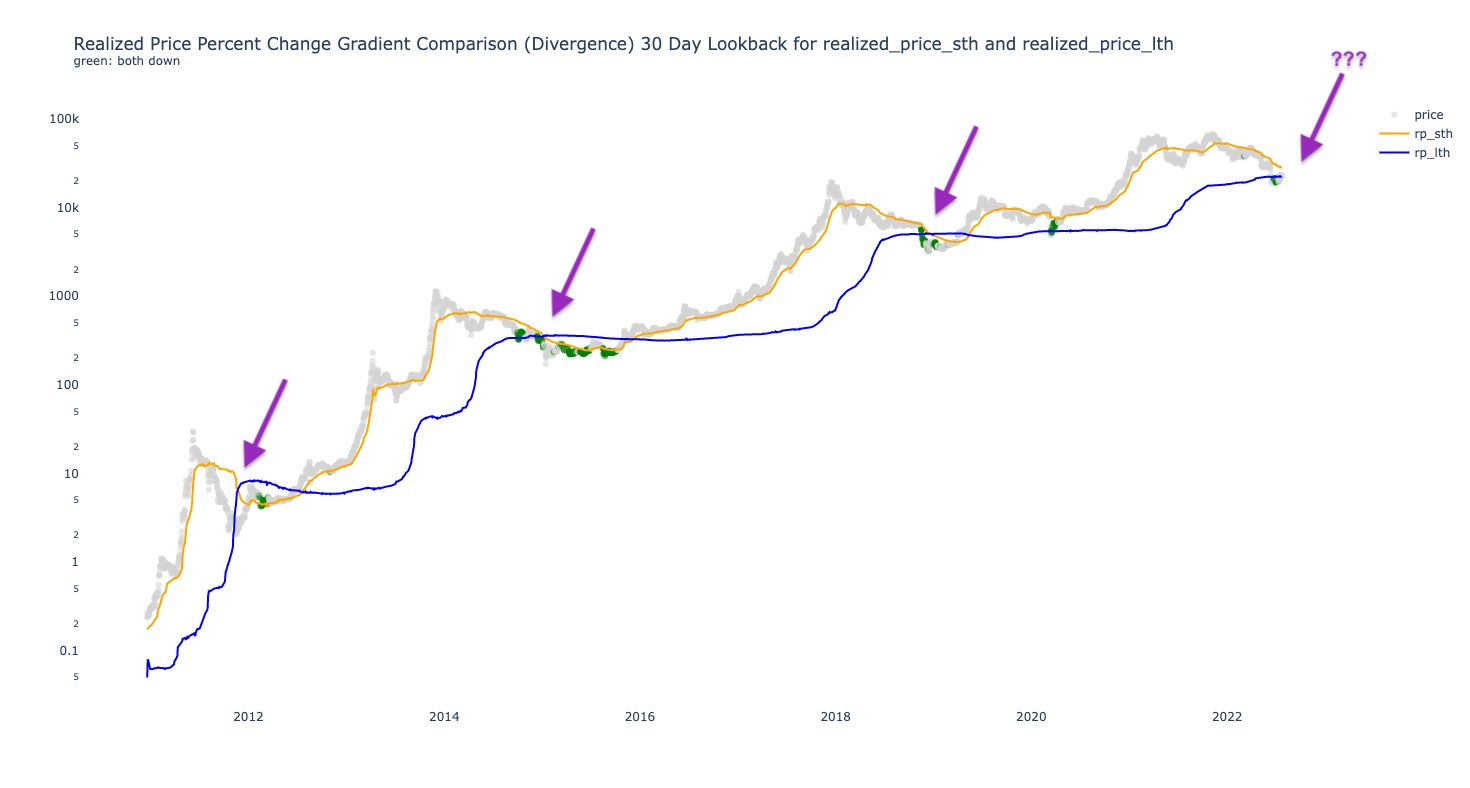
In all past drawdowns, these two have crossed. Again history isn’t necessarily an indicator of the present nor future, but given none of those happened during a Macro Recessionary environment, I would be hard-pressed to not bet on it happening again.
So my bet is on further downside. And. I could be wrong. Always ready to be invalidated and looking out for that.
4: Zooming In
On a shorter-term horizon, here’s the Binary Aggregate chart I built.
It combines some of the metrics I look at for confluence of momentum. Each of the metrics has a “above/below” signal that helps show whether it’s a good time to buy or not. I just put them all together.
It uses the:
Hodl Wave Crosses (24h-1m and 1m-3m)
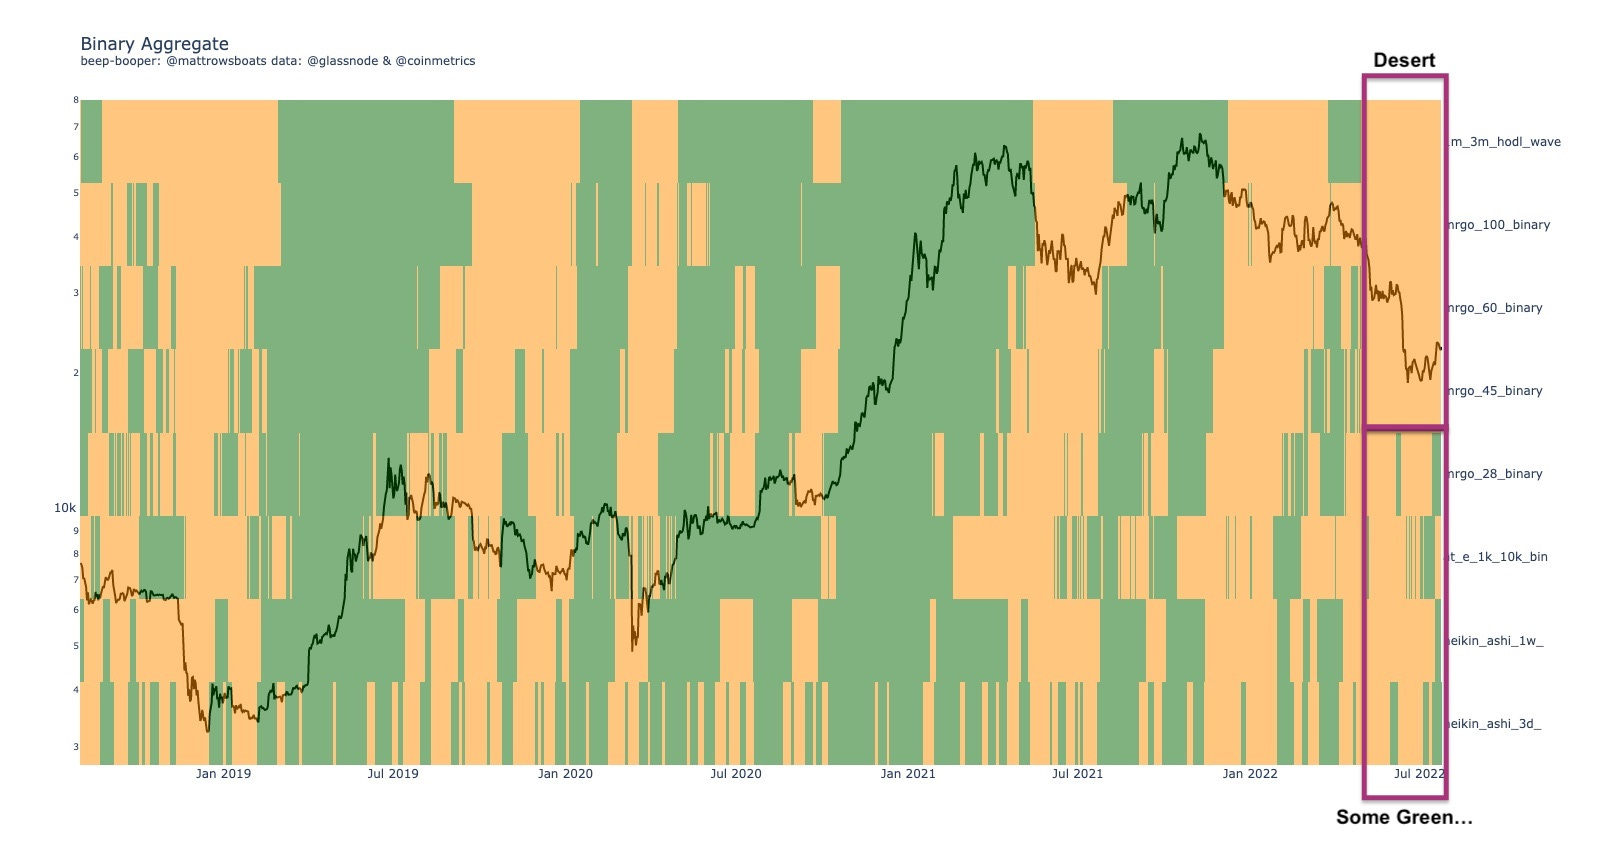
Some green sprouts on the lower half of the indicators but still desert above. For full confluence of a bullish impulse there needs to be all solid green across le board.
Still a time to be defensive and in cash from a short term perspective, imo.
5: Price Levels
So Macro is not great. But the long term buying opportunity is pretty amazing. But the short term is also not great.
What price levels should we be watching?
Nothing changed really from a TA (Technical Analysis) perspective.
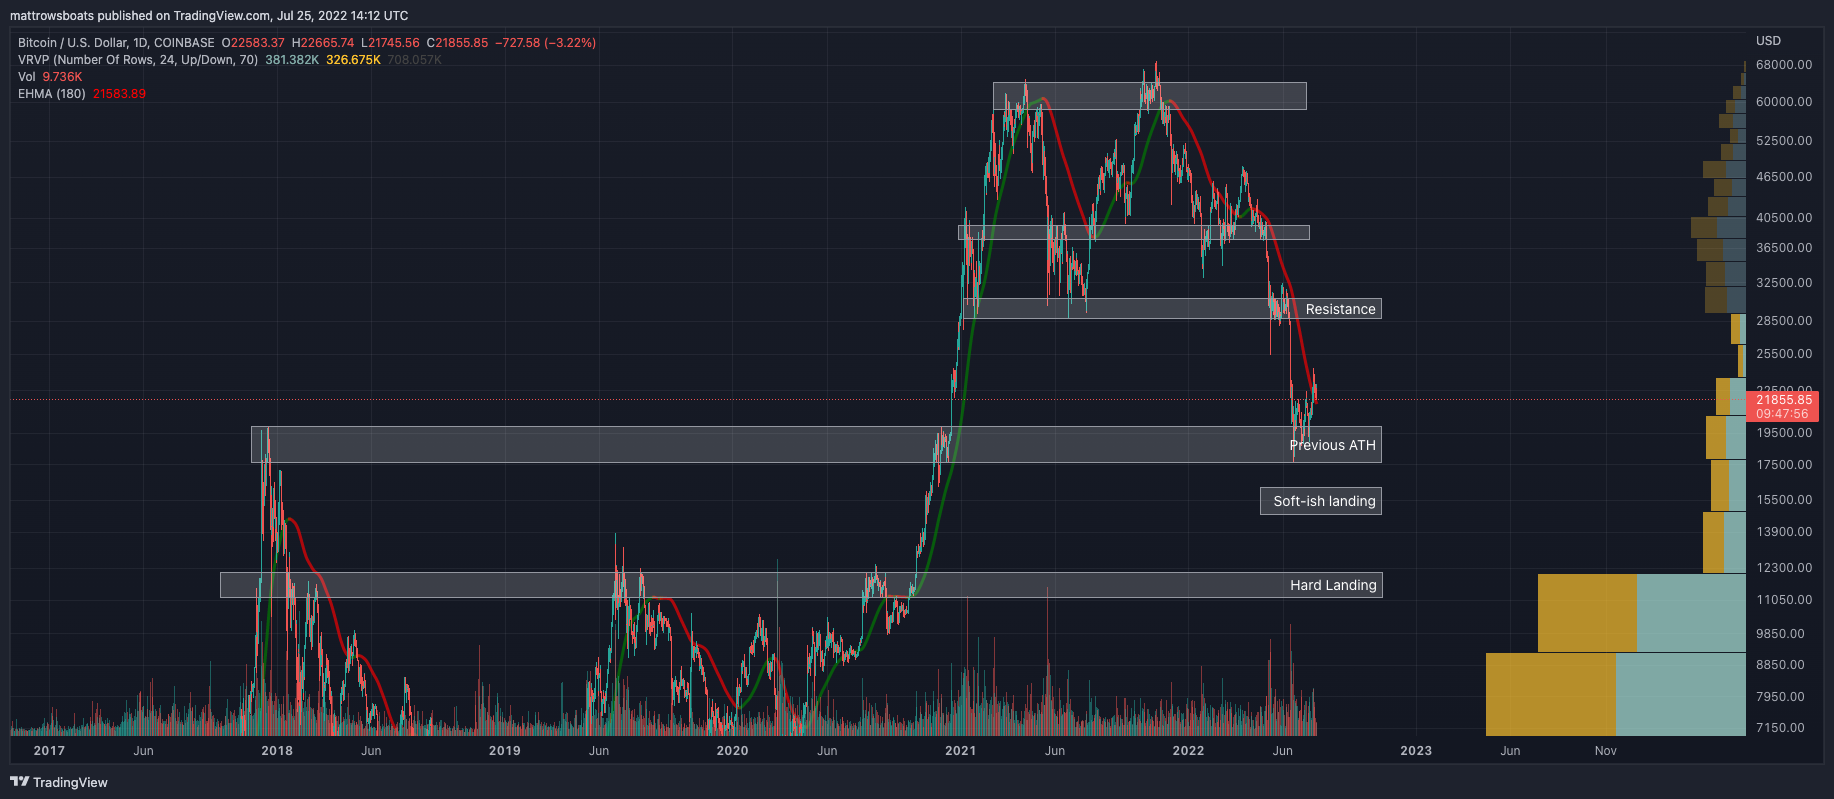
$14k-16k for a “soft-ish” landing. Around $10k for a hard landing. The previous ATH we are flirting around right now looks like quite weak support.
Here’s some updated (blockchain) On-Chain levels of note:
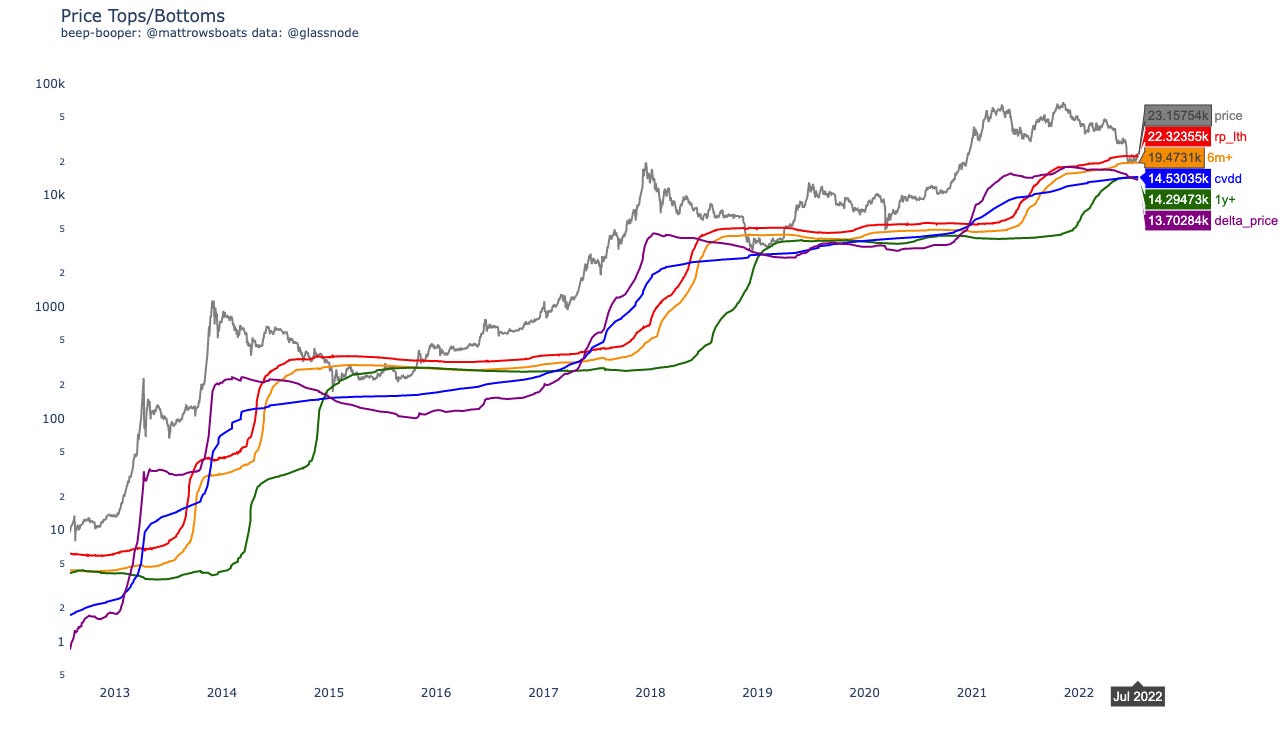
Given there’s some confluence for both TA + On-chain around $14k - $16k I would feel pretty good about targeting bids there. Breaks below that would feel like a temporary swan dive down.
6: “So… should I buy now or no?”
“I Dollar Cost Average (DCA)!”
Yes, I would be buying if I were you… one should always be buying on their DCA cadence 😏😊. As a reminder, DCA is great for folks who value an asset’s long-term potential but don’t have the time nor expertise to try and time tops/bottoms.
If you scale your DCA quantity by whether we are bearish or bullish, now is a great time to scale up the quantity (size or frequency) of your DCA since we are in such a bearish phase.
“I’m a long term 1-2 year investor.”
Yes, I would be and did buy some long-term holdings here. I will also buy more if it goes lower. My target is $14k - $16k for unloading a large portion of my cash bags. Remember, if you’re a 1-2 year investor, “exact timing” or “exact price levels” is a nonsense game to play. Patience is power for the long term investor.
“I’m a short term investor / trader.”
I still am not buying here. I know it’s boring and annoying to wait for lower lows and “miss out” and the bullish impulses within a larger bear environment. I get it. And… I don’t see any confluence on the desert (binary aggregate) chart above. The recessionary vibes are still looming and feeling like they’re growing. Alts are showing weakness like I mentioned in a previous letter (my instinct for alts ripping up 30% - 80% during a Recession feeling off so far is proving to be right).
In all things, remember: keeping capital safe and secure in a bear market is top priority.
7: Matt’s Portfolio
My Long Term Portfolio is still 80% in USD and 20% in BTC (put it in Cold Storage).
Trading, I’m still in USD and waiting for lower lows to come. In general, I’m still looking for and waiting for bullish convergence of data and indicators to jump back in. Invalidation to me would be a rip above $23k or more with strength (but even then I’d need to see a lot of consistent strength - without would be skeptical).
Still not there yet.
Stay safe folks 🤝.
8: Lol of the Day
A lol just in case the economy or whatever else has you down.
For that sweet sweet Venn Diagram Intersection of “Stranger Things Season 4” and “High School Musical 2” *chef’s kiss*.

Also I felt this 😂. “Hey wanna get dinner tonight?”

Closing
And that’s it! As always, if you have questions, desires for clarification, or thoughts on how to improve this letter for yourself or others please reply and let me know or reach out on Twitter.
Also, if you are interested in any kinds of individual consulting services regarding your own Bitcoin or Crypto journey (getting started, trading, analytics, learning, advising, etc.), feel free to respond to this email or follow / reach out to me on Twitter, where I also post more nuanced / individual metric-specific charts there more often.
As always, this post is free and if you enjoyed it or learned something feel free to share it 😊 🎉.
Thank you for reading!
Sincerely,
Matt Rowe
Links and References
Data Provider: Glassnode (free on-chain charts, paid tiers available, I have T3).
My Twitter: @mattrowsboats (often provides on-chain analysis)
Crypto Learning Twitter Lists: On-Chain, Macro-Econ, and TA.
Disclaimer 1
Exercise caution, don’t lose it all. Please don’t trade on this newsletter assuming it is perfect information. Everything here is probabilistic and based off of past patterns, which may prove to be invalidated. Short time frames are subject to less accuracy as markets can change on a dime due to a variety of factors and events in the world. Use risk management as much as possible.
Disclaimer 2 (the all caps one)
THE CRYPTROWE NEWSLETTER DOES NOT MAKE ANY EXPRESS OR IMPLIED WARRANTIES, REPRESENTATIONS OR ENDORSEMENTS WHATSOEVER WITH REGARD TO THE REPORT/BLOG. IN PARTICULAR, YOU AGREE THAT THE CRYPTROWE NEWSLETTER ASSUMES NO WARRANTY FOR THE CORRECTNESS, ACCURACY AND COMPLETENESS OF THE REPORT/BLOG.
YOU ARE SOLELY RESPONSIBLE FOR YOUR OWN INVESTMENT DECISIONS. WE ARE NEITHER LIABLE NOR RESPONSIBLE FOR ANY INJURY, LOSSES OR DAMAGES ARISING IN CONNECTION WITH ANY INVESTMENT DECISION TAKEN OR MADE BY YOU BASED ON INFORMATION WE PROVIDE. NOTHING CONTAINED IN THE REPORT/BLOG SHALL CONSTITUTE ANY TYPE OF INVESTMENT ADVICE OR RECOMMENDATION (I.E., RECOMMENDATIONS AS TO WHETHER OR NOT TO “BUY”, “SELL”, “HOLD”, OR TO ENTER OR NOT TO ENTER INTO ANY OTHER TRANSACTION INVOLVING ANY CRYPTOCURRENCY). ALL INFORMATION PROVIDED BY THE CRYPTROWE NEWSLETTER IS IMPERSONAL AND NOT TAILORED TO YOUR NEEDS.
BY USING THIS REPORT/BLOG, YOU ACKNOWLEDGE THESE DISCLAIMERS.