
CryptRowe Forecast #19
Le boring (is anything new?)

The CryptRowe Newsletter provides Math, Stats, and Data insight around the current state of Bitcoin and other Digital Assets. Whether you’re new to Crypto, have some experience, or are a seasoned investor or institutional fund manager, this newsletter is for you.
Dear Reader,
Hello and welcome to another edition of the bi-weekly CryptRowe newsletter! 🎉
Since we last met, Bitcoin has been doing… not much. ¯\_(ツ)_/¯ Just hanging around between $21.5k and $19.5k. Le boring.
We know le boring won’t continue forever, so what do we think is most likely to happen next, and why?
Let’s tune in and keep reading to find out 🙃.
Sincerely,
Matt Rowe
As a reminder, this email might cut off or not fit into most inboxes so be sure to click “read more” at the bottom or just click the title at the top of the email to be taken to the Newsletter webpage.
Table of Contents
TLDR;
Macro Lens
Zooming Out
Zooming In
Price Levels
“So… should I buy now or no?”
Matt’s Portfolio
Lol of the Day
1: TLDR;
Macro Economy: Still not great and not great for risk-on assets like Bitcoin and other digital assets.
Long Term Investors: buying Bitcoin here has historically led to (outsized) positive returns in 6 mo. to 1 year.
Short Term Traders: I’m still expecting further downside over the coming weeks. Invalidation would be sustained movement above $25k.
2: Macro Lens
Lets review our running list of what we’re tracking with our Macro perspective and what we’ve learned and captured over the previous newsletters:
We are most likely in or heading into a Recession. And since Bitcoin is a Risk-On asset (currently), those don’t do well, usually, during a Recession.
QT has begun (and is still slowly ramping up), which adversely affects Risk-On assets (again, of which BTC is currently).
The US got / confirmed two negative quarters of growth (GDP), which some folks use to define a Recession, and others are arguing is an inadequate definition. You can read more about a summary of this from a previous newsletter here.
Official inflation predictions are unreliable and kind of wishy-washy.
Crypto Related: ETH Merge is upcoming and lots of volatility is expected.
And as for this week… honestly I don’t have a ton to add on le macro front.
The dollar is strengthening further, employment indicators (usually lagging during a recession) are starting to show cracks, and the energy issues between Russia and Europe are continuing to cause problems. Europe seems like it’s in a bind - they don’t want to buy oil and gas from Russia because that would mean supporting the invasion of Ukraine, but they also need oil and gas to keep their citizens, you know, living well and thriving in their own country. So as for now, it seems like things are at a tenuous standstill with Russia not selling anymore to Europe and Europe not buying anymore from Russia. However, Russia is selling to China and China is selling to Europe 😬🤦🏼♂️.
So in summary there’s lots of global uncertainty and the recession seems to continue to slowly trickle in along with geopolitical turmoil and uncertainty… like a storm rolling in from the horizon.
There are much better and more nuanced and insightful takes on all of this, especially the energy issues going on in Europe and how that can affect other parts of the world, from Lyn Alden, Ecoinometrics, TXMC, and Mr. Alf. They know more than me about Macro things. Go to them for more 🙃.
3: Zooming Out
So the Macro Economic picture is uncertain and still recession-y, but what about High Time Frame (HTF, zoomed-out) data for Bitcoin? My Aggregate Bitcoin On-Chain indicator (below) combines about 14 On-Chain and Technical Analysis indicators.
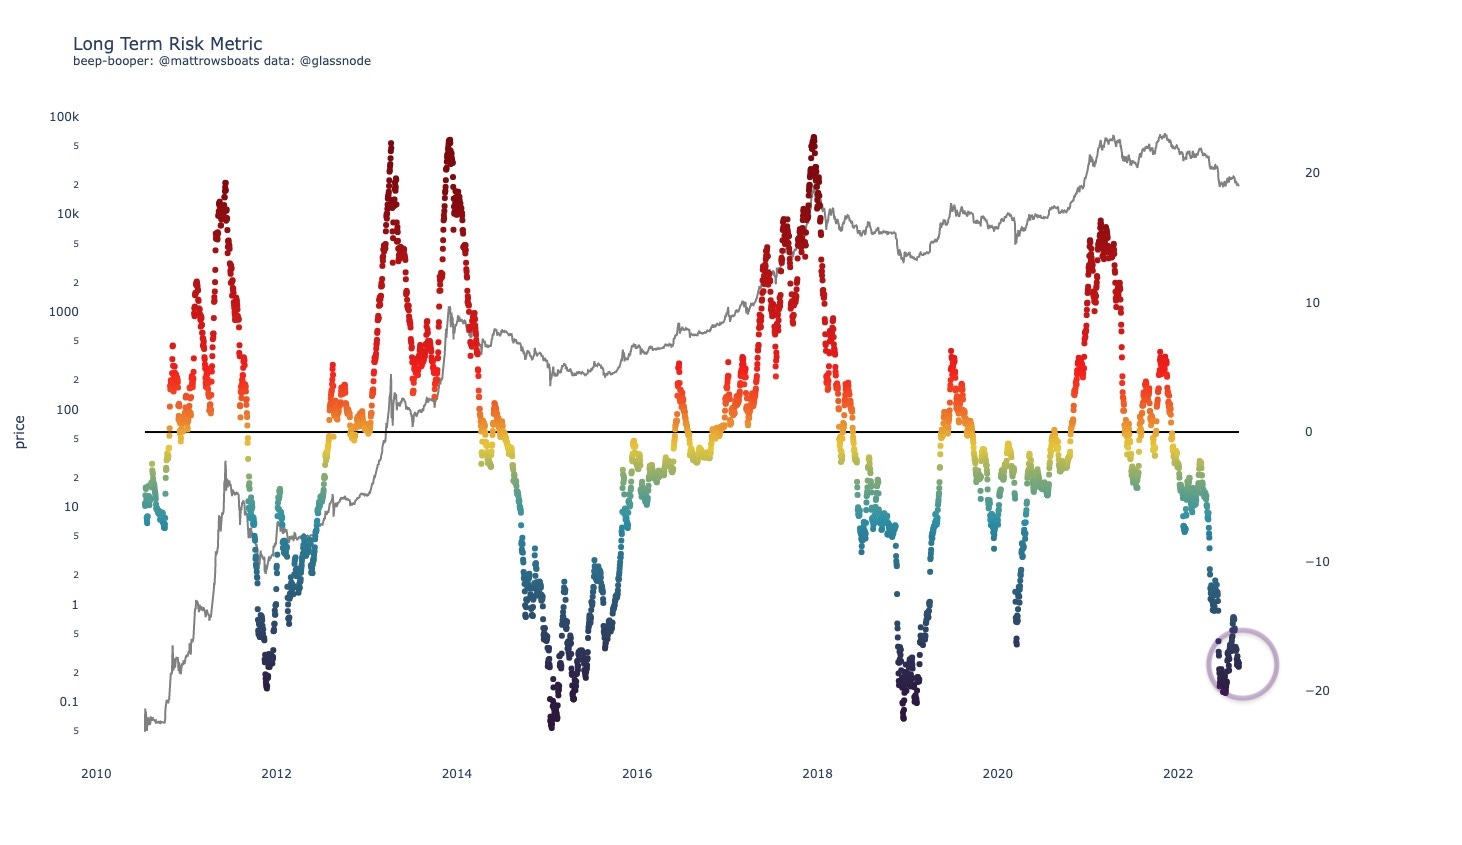
So we are still in a very great long-term buying opportunity. And last time we re-did the outlook analysis and it’s still looking solid 180+ days out.
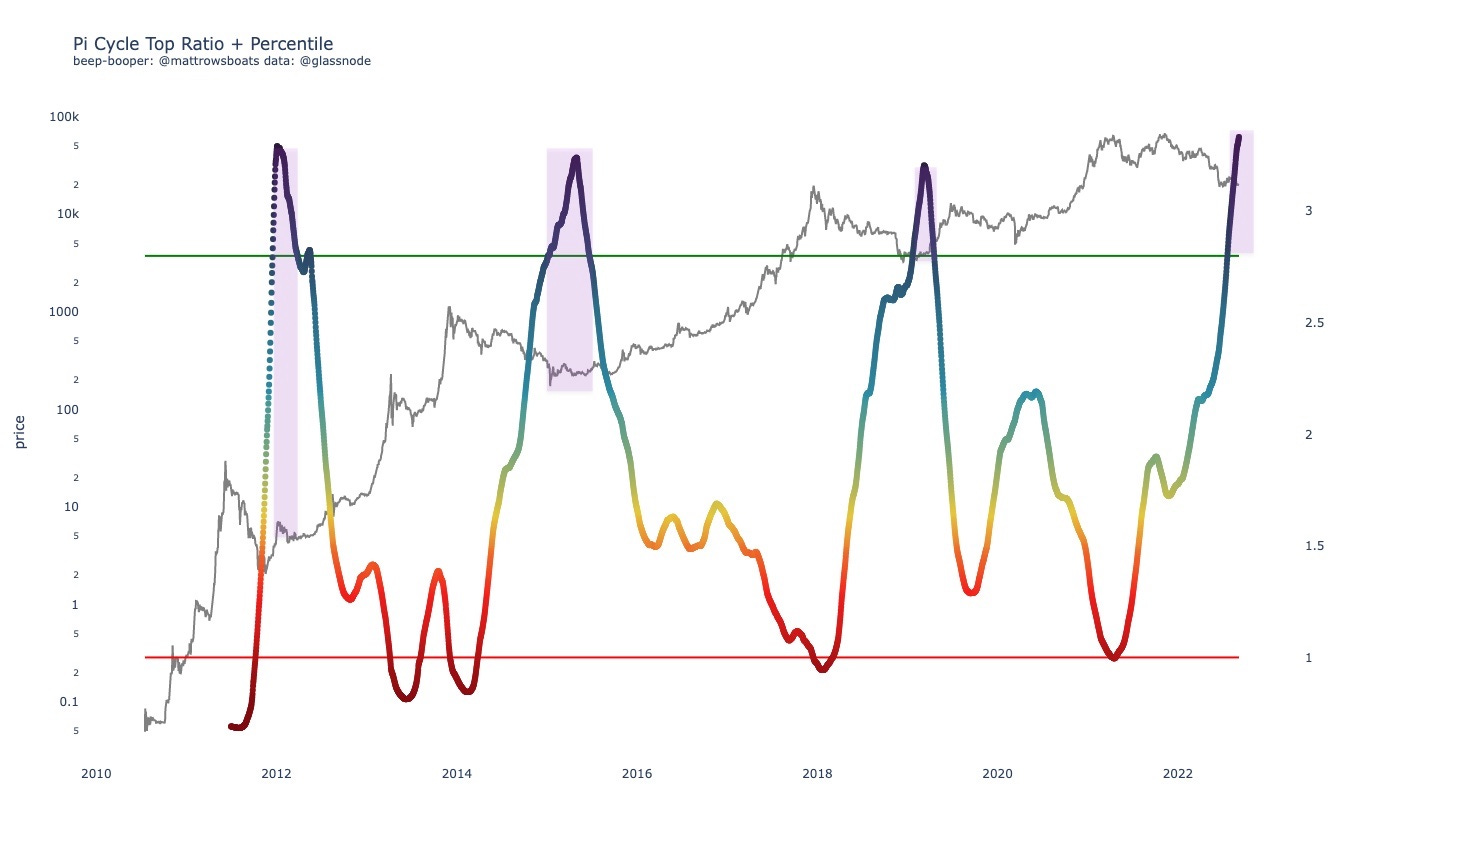
And if you want another “long term buying opportunity” chart here’s the Pi Cycle Ratio. It could be different this time, of course (small sample size), but also… ¯\_(ツ)_/¯.
4: Zooming In
On a shorter-term horizon, here’s the Binary Aggregate chart I built.
It combines some of the metrics I look at for confluence of momentum. Each of the metrics has a “above/below” signal that helps show whether it’s a good time to buy or not. I just put them all together.
It uses the:
Hodl Wave Crosses (24h-1m and 1m-3m)
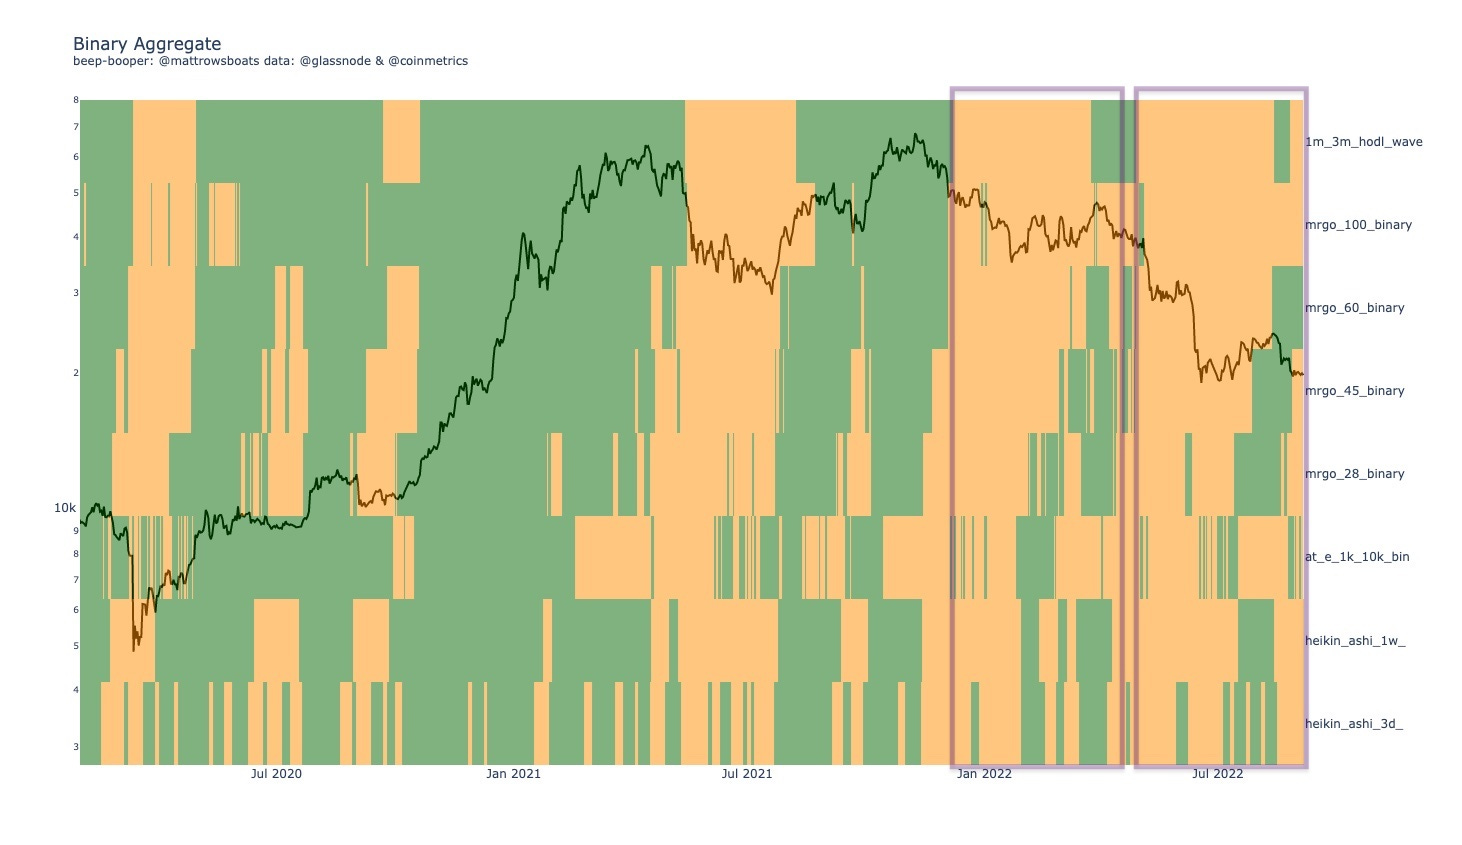
So for sustained run-ups, we need to usually see the chart flood with green. We don’t see that now. We see an attempt at that, and then we went back to desert land. The two rectangles look surprisingly similar ¯\_(ツ)_/¯.
Regarding the stacking of size-based cohorts:
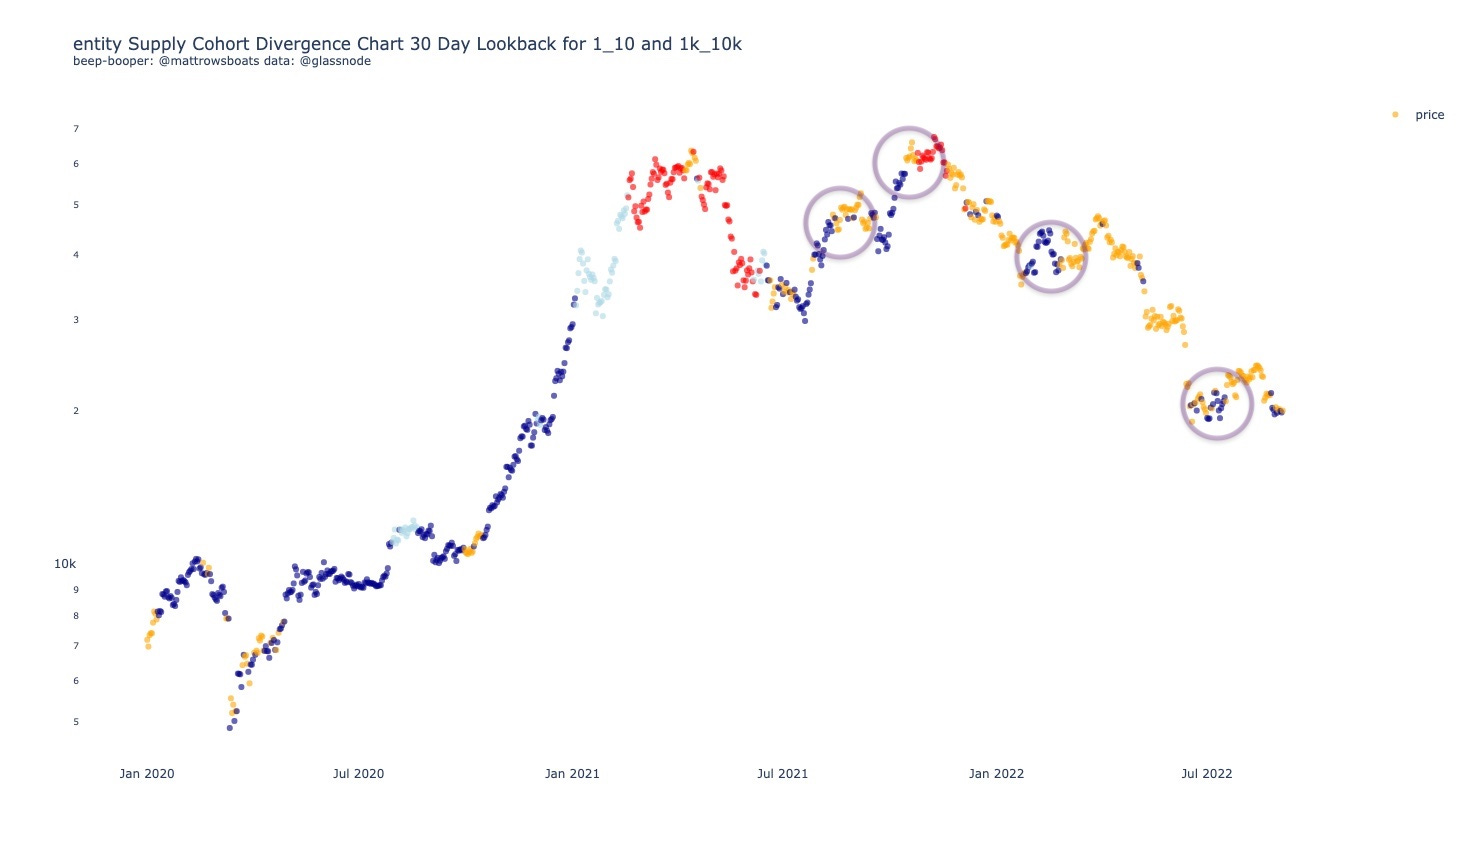
We see some more dark blue starting now but… like the rest of the cohorts that stacking that is happening is weak (not much change from last newsletter).
Also for fun, if you’re curious and want to see if you can spot any patterns - here’s the URPD Entity Adjusted Chart over time I made:


Basically the darker the colors the more % of supply that has transacted at that level.
All of this combined tell me that, the odds seem skewed towards more downside in the coming weeks to months.
5: Price Levels
So Macro is not great. But the long term buying opportunity is pretty amazing. But the short term is skewed / biased towards more downside.
The price levels from the last few newsletters haven’t changed so I’m not going to update those because there isn’t much to update ¯\_(ツ)_/¯.
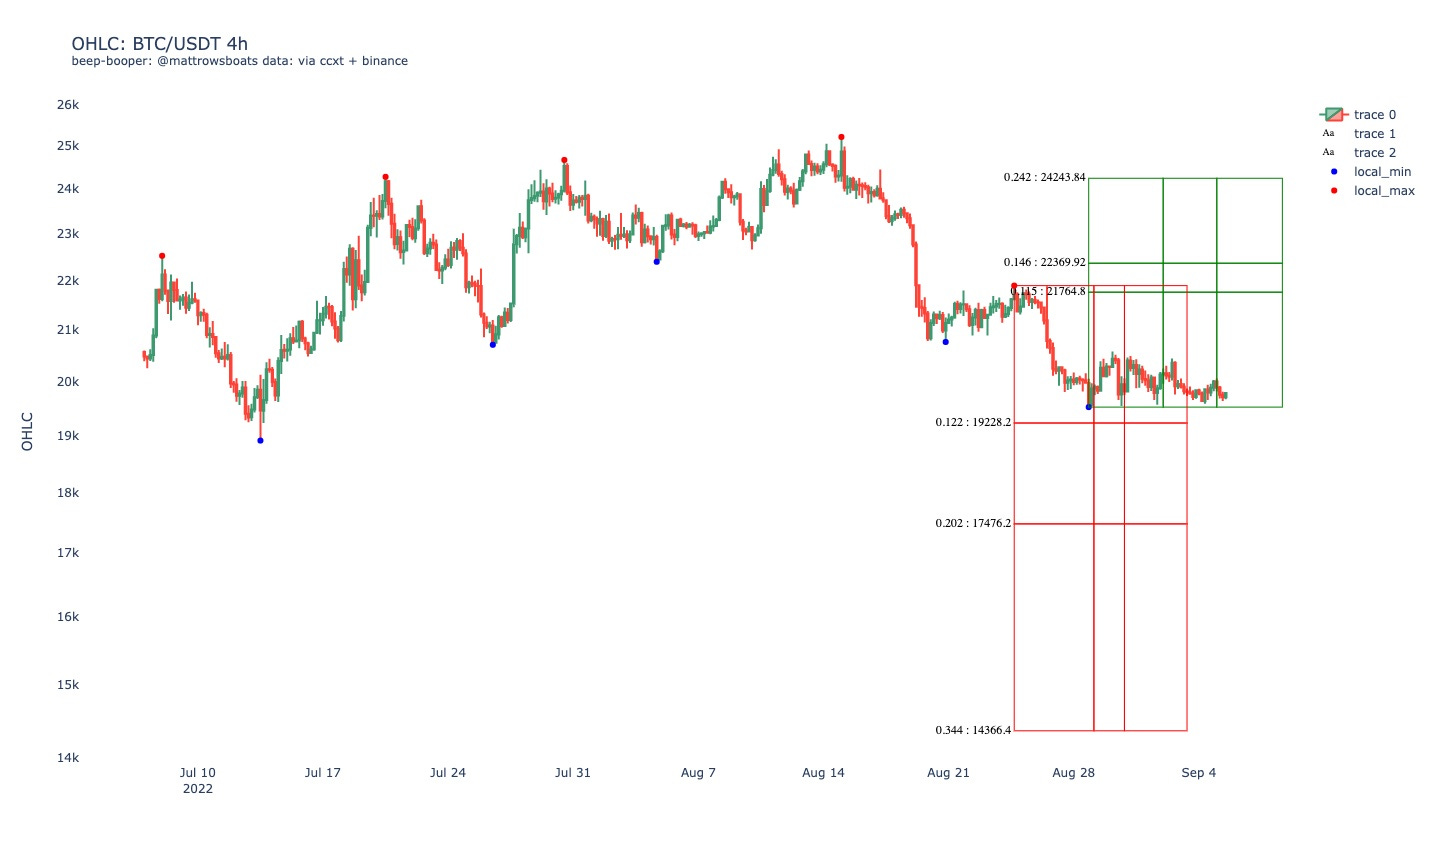
But I thought it could be fun to show you something else I built recently. Basically, it takes the history of a digital asset’s price movement, and identifies local tops to bottoms and vice versa, and then does some math on them (quartiles) - and tells us then “historically, how long do impulses up or down last and how far do they go?”
So the one for Bitcoin looks like this:
And the one for ETH looks like this:
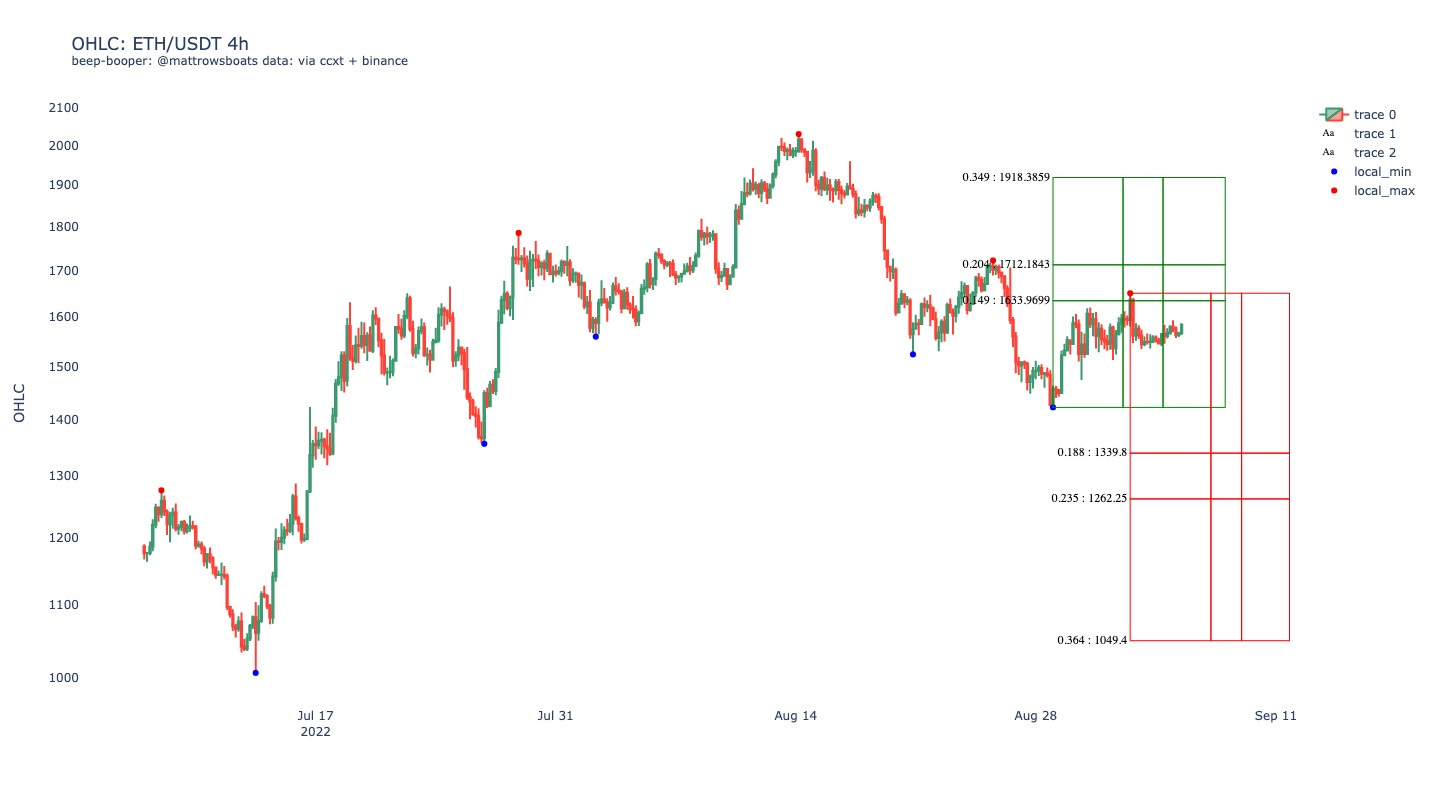
Each “line” in the green or red box represents a historical quartile - 25th percentile. So looking at the ETH chart above, for example, tells us that this current bullish impulse has passed the 50th percentile for duration of a bullish impulse but hasn’t quite crested the 25th percentile of percent-change. And for the potential upcoming bearish impulse (can have early false positives for the most recent impulse signal) we haven’t crossed the 25th percentile for duration nor percent change. More on all of this can be found here.
6: “So… should I buy now or no?”
“I Dollar Cost Average (DCA)!”
Yes, I would be buying if I were you… one should always be buying on their DCA cadence 😏😊. As a reminder, DCA is great for folks who value an asset’s long-term potential but don’t have the time nor expertise to try and time tops/bottoms.
If you scale your DCA quantity by whether we are bearish or bullish, now is a great time to scale up the quantity (size or frequency) of your DCA since we are in such a bearish phase.
“I’m a long term 1-2 year investor.”
Yes, I would be and did buy some long-term holdings around $20k. I will also buy more if it goes lower. My target is $14k - $16k for unloading a large portion of my cash bags. Remember, if you’re a 1-2 year investor, “exact timing” or “exact price levels” is a nonsense game to play. Patience is power for the long term investor.
“I’m a short term investor / trader.”
I still am not buying here. Le sigh. I know it’s boring and annoying to wait for lower lows and “miss out” and the bullish impulses within a larger bear environment. I get it. And… I don’t see the kind of confluence I want in the shoter-term time frames above. That combined with recessionary vibes that still loom (and seem to be growing), I’m not comfortable advocating for shorter term plays right now for myself.
In all things, remember: keeping capital safe and secure in a bear market is top priority.
7: Matt’s Portfolio
My Long Term Portfolio is still 80% in USD and 20% in BTC (put it in Cold Storage).
Trading, I’m still in USD and waiting for lower lows to come. In general, I’m still looking for and waiting for bullish convergence of data and indicators to jump back in. Invalidation to me would be a rip above $25k or more with strength (but even then I’d need to see a lot of consistent strength - without would be skeptical).
Still not there yet.
Stay safe folks 🤝.
8: Lol of the Day
A lol just in case the economy or whatever else has you down.
So I laughed at this one way too much. This song was re-popularized by Stranger Things Season 4.

And if that wasn’t your cup of tea maybe these will be:


Closing
And that’s it! As always, if you have questions, desires for clarification, or thoughts on how to improve this letter for yourself or others please reply and let me know or reach out on Twitter.
Also, if you are interested in any kinds of individual consulting services regarding your own Bitcoin or Crypto journey (getting started, trading, analytics, learning, advising, etc.), feel free to respond to this email or follow / reach out to me on Twitter, where I also post more nuanced / individual metric-specific charts there more often.
As always, this post is free and if you enjoyed it or learned something feel free to share it 😊 🎉.
Thank you for reading!
Sincerely,
Matt Rowe
Links and References
Data Provider: Glassnode (free on-chain charts, paid tiers available, I have T3).
My Twitter: @mattrowsboats (often provides on-chain analysis)
Crypto Learning Twitter Lists: On-Chain, Macro-Econ, and TA.
Disclaimer 1
Exercise caution, don’t lose it all. Please don’t trade on this newsletter assuming it is perfect information. Everything here is probabilistic and based off of past patterns, which may prove to be invalidated. Short time frames are subject to less accuracy as markets can change on a dime due to a variety of factors and events in the world. Use risk management as much as possible.
Disclaimer 2 (the all caps one)
THE CRYPTROWE NEWSLETTER DOES NOT MAKE ANY EXPRESS OR IMPLIED WARRANTIES, REPRESENTATIONS OR ENDORSEMENTS WHATSOEVER WITH REGARD TO THE REPORT/BLOG. IN PARTICULAR, YOU AGREE THAT THE CRYPTROWE NEWSLETTER ASSUMES NO WARRANTY FOR THE CORRECTNESS, ACCURACY AND COMPLETENESS OF THE REPORT/BLOG.
YOU ARE SOLELY RESPONSIBLE FOR YOUR OWN INVESTMENT DECISIONS. WE ARE NEITHER LIABLE NOR RESPONSIBLE FOR ANY INJURY, LOSSES OR DAMAGES ARISING IN CONNECTION WITH ANY INVESTMENT DECISION TAKEN OR MADE BY YOU BASED ON INFORMATION WE PROVIDE. NOTHING CONTAINED IN THE REPORT/BLOG SHALL CONSTITUTE ANY TYPE OF INVESTMENT ADVICE OR RECOMMENDATION (I.E., RECOMMENDATIONS AS TO WHETHER OR NOT TO “BUY”, “SELL”, “HOLD”, OR TO ENTER OR NOT TO ENTER INTO ANY OTHER TRANSACTION INVOLVING ANY CRYPTOCURRENCY). ALL INFORMATION PROVIDED BY THE CRYPTROWE NEWSLETTER IS IMPERSONAL AND NOT TAILORED TO YOUR NEEDS.
BY USING THIS REPORT/BLOG, YOU ACKNOWLEDGE THESE DISCLAIMERS.